Estimated reading time: 4 minutes
Making the most of score variation in war gaming and sensitivity analysis
Over the past few years, consultants in our expert services team have been turning more frequently to the use of war gaming sessions as a way of testing different aspects of procurement policy and of refining the approach of our clients. Whilst war gaming cannot tell us what is going to happen, it can help us understand what might happen.
Typically, a war gaming session works as follows: a panel of experts from the client’s project team uses its knowledge of the market to give putative scores to a number of typical supplier scenarios. These are then used to carry out various ‘what-if’ exercises, with the aim of avoiding issues that could lead to an undesirable outcome.
Whilst these sessions definitely have their place, a panel can often fail to provide an agreed score for a scenario. At the very least this takes up time, which usually runs short on these occasions, but it can often be very disruptive. It is, of course, good to have healthy discussion – and that’s one of the secondary purposes of war gaming – but a grudgingly agreed compromise score never feels right somehow.
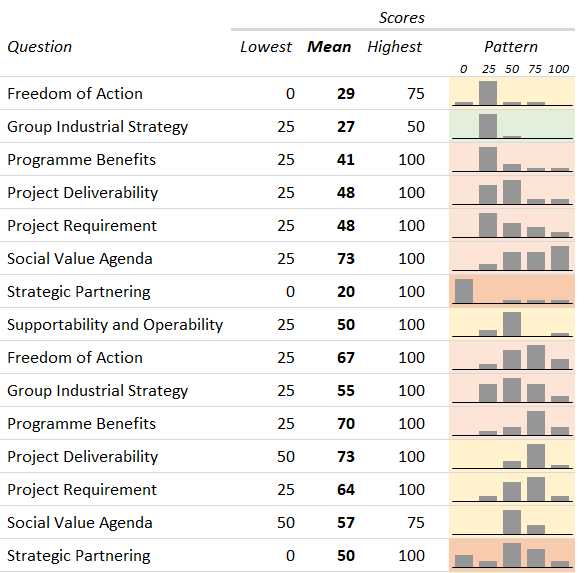
A recent example where this was particularly apparent arose during an investment options exercise, where the scores given by a dozen or so panellists showed huge variation. We can, of course, take an arithmetic mean in order to get a single numerical result, but having six people say that something is great and six say that it’s no good isn’t really the same as the middling score that averaging provides.
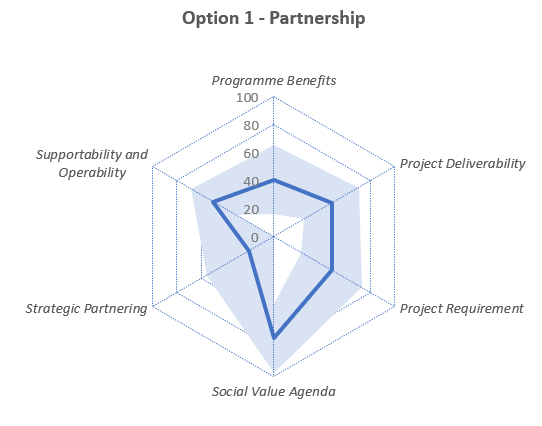
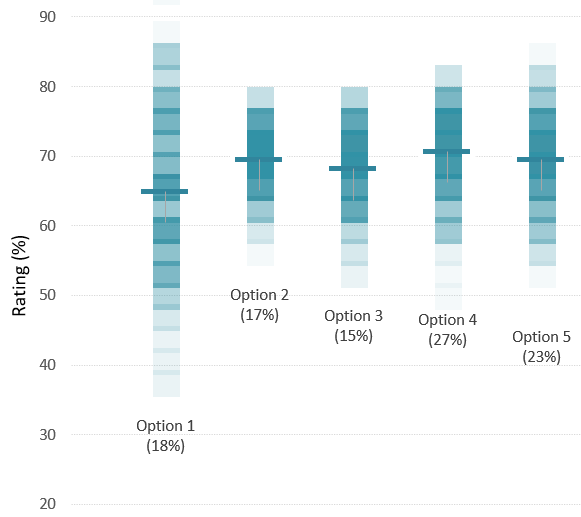
So, how do you overcome this challenge? Our approach is to use averaging to get headline scores and hence a nominal ranking for the scenarios, but we also use the variation data to understand the validity of those scores. Specifically, we generate sets of results by choosing a panel member’s answer at random for each question for each scenario. We note which scenario has the highest score, and then repeat this many times over as a “Monte Carlo” type of analysis. Once all these random selections have been made, the number of wins for each scenario can be expressed as a simple percentage.
The result? Looking at scenarios with similar averaged scores, we find that those with a wide variation in their scores are favoured by this sampling approach, because they are more likely to win out in each n-way comparison; the fact that they have more high scores than other scenarios is more important than having more low scores. In fact, the approach amplifies the differences between scenarios, so those that are slightly ahead on the averaged scores come out as much more favoured in the win rate percentages.
This all has to be written up, of course. It is important to describe the methods used so that they make sense to key stakeholders who weren’t involved in the actual war gaming session. We have to make sure than any conclusions are based firmly on data and can stand up to external scrutiny. But this is time well spent, as it can help avoid delay caused by revisiting the same issues without any firm conclusion.
This analysis is part of our standard toolset for war gaming – if you’d like to find out more about our consultancy offering please get in touch with our team below.